Bar ranges
Bar ranges turn a utility device's number into something you can read at a glance: you define value bands with a color each (say green up to 800 watts, amber to 2000, red above), and the interface shows the current value as a marker on a colored strip. One look tells you whether the value is where it should be.
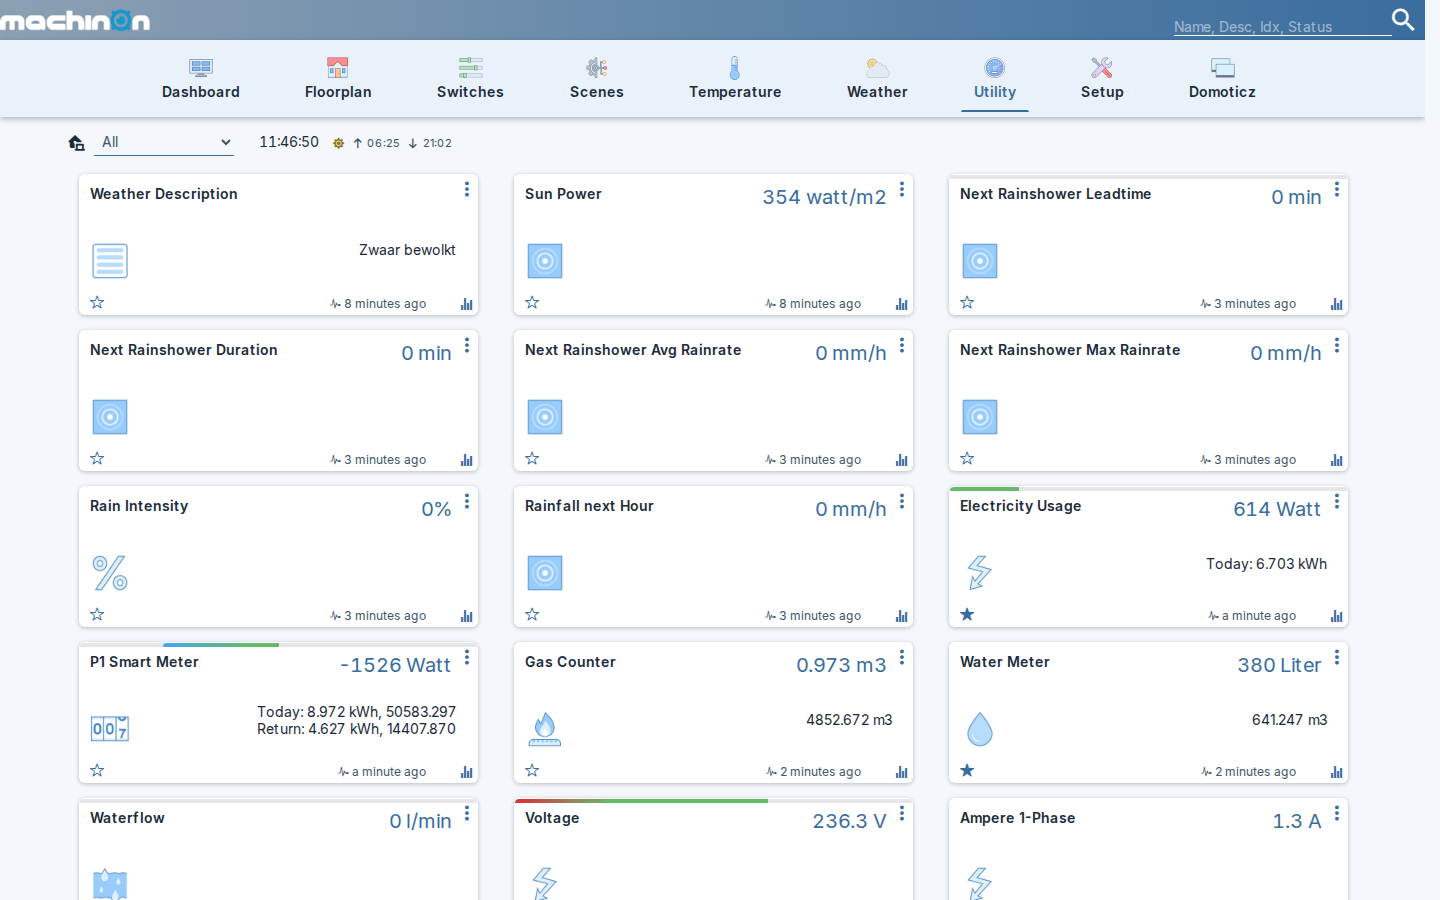
Domoticz itself shows these strips in two places: on the device's card on the Utility page, and in stat widgets on the Dynamic Dashboard. Machinon adds a third: the same bands painted across the charts on the device's Log page, so history gets the same at-a-glance reading as the live value.
Setting ranges on a device
You need a device that shows a bar, which covers most Utility-page types: energy and power meters, the P1 smart meter, gas, water and counter devices, percentage, voltage, current, lux, air quality, sound level, and custom sensors.
- Open the Utility page and open the device's card menu (the three dots), then choose Edit.
- On the edit page, click the small bar-chart button in the top-right corner of the form. The Bar Ranges dialog opens.
- Add one row per band: a From value, a To value, and a color. If the list is empty, Seed defaults gives you a starting set to adjust. The trash icon removes a row; Clear all empties the list.
- Click Save to close the dialog, then save the edit page itself (Update). The ranges are stored on the device.
The strip appears on the device's Utility card right away. Bands can start below zero, which is useful for meters that can run backwards: give the P1 smart meter a band like -3000 to 0 in its own color and exporting solar power gets its own visual state.
Range bands on the Log charts
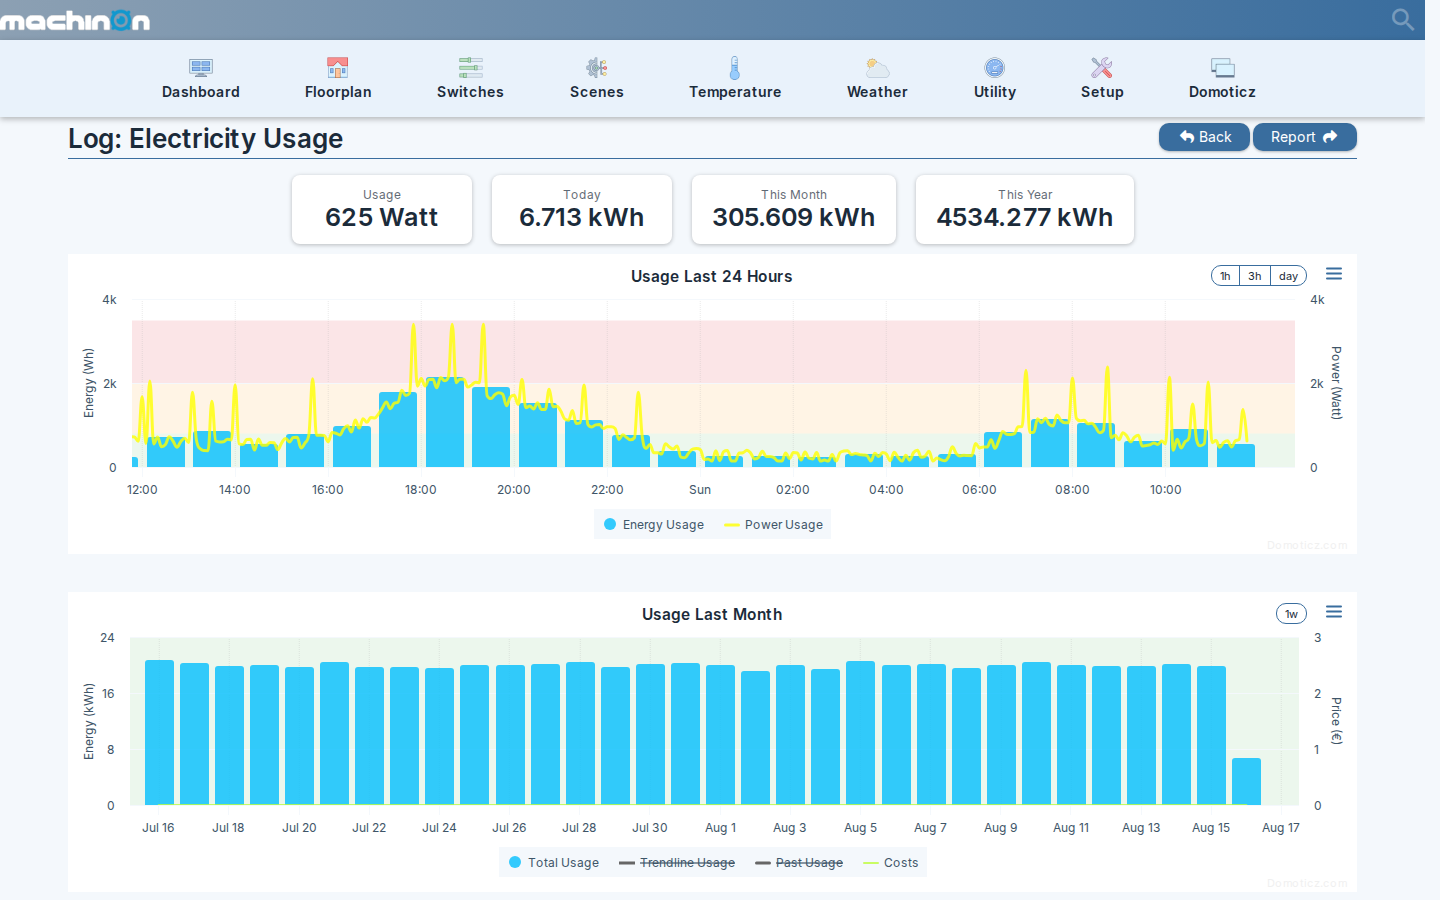
With the theme's Range bands in log graphs setting (Theme Hub, Charts group; on by default), a ranged device's Log page paints the same bands as background zones on its charts, as in the screenshot below. Standard Domoticz never draws them there. Turning the setting off needs a page reload to take effect; the Theme Hub shows a reload prompt when that applies.
Notes
- Ranges are per device. A device without ranges shows a plain card and plain charts.
- A value outside the outermost band clamps to the end of the strip.
- The ranges are stored in the device itself (not in the theme), so they survive theme changes and show up in the Dynamic Dashboard's stat widgets too.